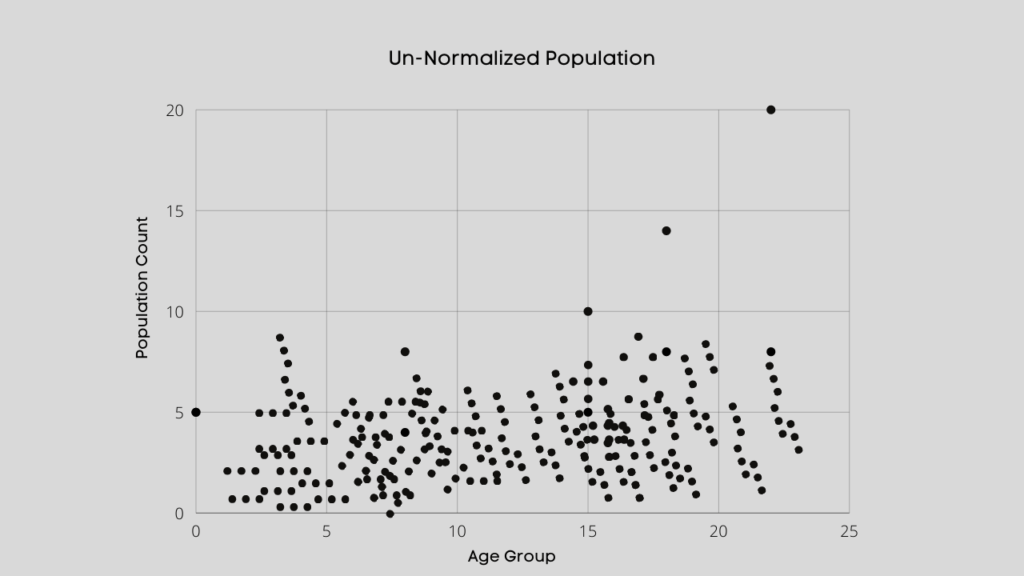
In this article, we are going the see the importance of data normalization in machine learning and how we can easily normalize the data.
Normalization is nothing but the process to standardized the data for correct analysis or predictive modeling.
Normalization is the part of data scaling or we can say it is the first and basic step of scaling the data to get in the right standard form.
The advanced level of scaling data (Feature Scaling) is the standardization of the data that convert data in the form of mean equal to zero (mean=0) and variance equal to one (variance = 1).
What is Data Normalization in machine learning?
Normalization is the process to make the data in a normal form that means creating the right balance in data using a different mathematical approach.

It is also called the data balancing process that converts the imbalanced data into the balance form to get the accurate result from predictive modeling and reach the maximum accuracy level.
Data after normalization can spread on a complete graph, which you can easily visualize using a scatter plot this is the best approach to understand the normalized data.

How to normalize data for Machine Learning?
Normalization of data for machine learning is the data scaling process from zero to one range that balances the data for analysis.
It is the process to transform the various forms of data so that it lies on the same scale.
Similarly, it has several ways to do that but we will focus on top suitable and well know practices that mostly use for scaling the data.
The following most important ways you can use to scale the data like Mean Normalization, Min-Max Scaling, Z-Score Normalization, Unit Vector.
1. Mean Normalization:
The first and easy way to perform normalization on data is to scales it in between [-1 to +1] with µ = 0.

It is the first and efficient way to normalized the data using normalize() function in python.
import pandas as pd
from sklearn import preprocessing

dict_var = {'Numbers':[7, 4, 823, 30, 0.2, 56, 234, -23, 1000, 23]}
df = pd.DataFrame(dict_var)
normalized_col = preprocessing.normalize(df)

print(normalized_col)
2. Min-Max Scaling:
It is another data normalization technique use to scales the data between zero and one [0, 1]. It is a simple way to normalized data using min-max functions using python.

df['Min_Max_Scale'] = (df['Numbers'] - df['Numbers'].min()) / (df['Numbers'].max() - df['Numbers'].min())

print(df['Min_Max_Scale'])
3. Z-score Normalization:
The third way to scale the data using z-score normalization or Standardization and it use to scales the data in the range of 0 to 1, and it requires the data in (mean is 0 and variance is 1) normalize form.

df['Z-Score'] = (df['Numbers'] - df['Numbers'].mean()) / df['Numbers'].std()

print(df['Z-Score'])
4. Unit Vector Scaling:
The most interesting approach is to normalize the data using the unit vector scaling process which specifically perform on every single vector.

Vector normalization is the process to take any size of the vector and point it in a similar direction by changing its length to one or scaling in between zero to one that’s called a unit vector.

df['Unit_Vector'] = preprocessing.scale(df['Numbers'])

print(df['Unit_Vector'])
Conclusion
Normalization is the significant and essential factor in the predictive machine learning process that decides the impact of your ml model.
It doesn’t matter how great and impactful a feature and dataset you have, without normalizing those features can affect each other to decrease the performance of your model.
Recommended Articles:
Gradient descent Derivation – Mathematical Approach in R
What Is A Statistical Model? | Statistical Learning Process.
What Are The Types Of Machine Learning? – In Detail
What Is A Supervised Learning? – Detail Explained
A Complete Guide On Linear Regression For Data Science
What Is Exploratory Data Analysis? | EDA In Data Science

Meet Nitin, a seasoned professional in the field of data engineering. With a Post Graduation in Data Science and Analytics, Nitin is a key contributor to the healthcare sector, specializing in data analysis, machine learning, AI, blockchain, and various data-related tools and technologies. As the Co-founder and editor of analyticslearn.com, Nitin brings a wealth of knowledge and experience to the realm of analytics. Join us in exploring the exciting intersection of healthcare and data science with Nitin as your guide.


