Exploratory data analysis also called EDA is the statistical analysis method for data construction and analysis massively practiced in the modern world of data science.
In data science call it an EDA which can do sets of actions like summarize the major part of data and apply a variety of visualization methods.
A statistical model can be used for fundamentally the EDA process to check what the data can tell us behind the formal modeling or hypothesis testing task.
In simple language, Exploratory data analysis utilizes statistical methods to interpret the data and prepare the right insight from it for more reliable data modeling.
The process of data exploration and processing work with hypotheses testing and different data transformation and validation methods are applied to the newly collected data in the Exploratory data analysis process.
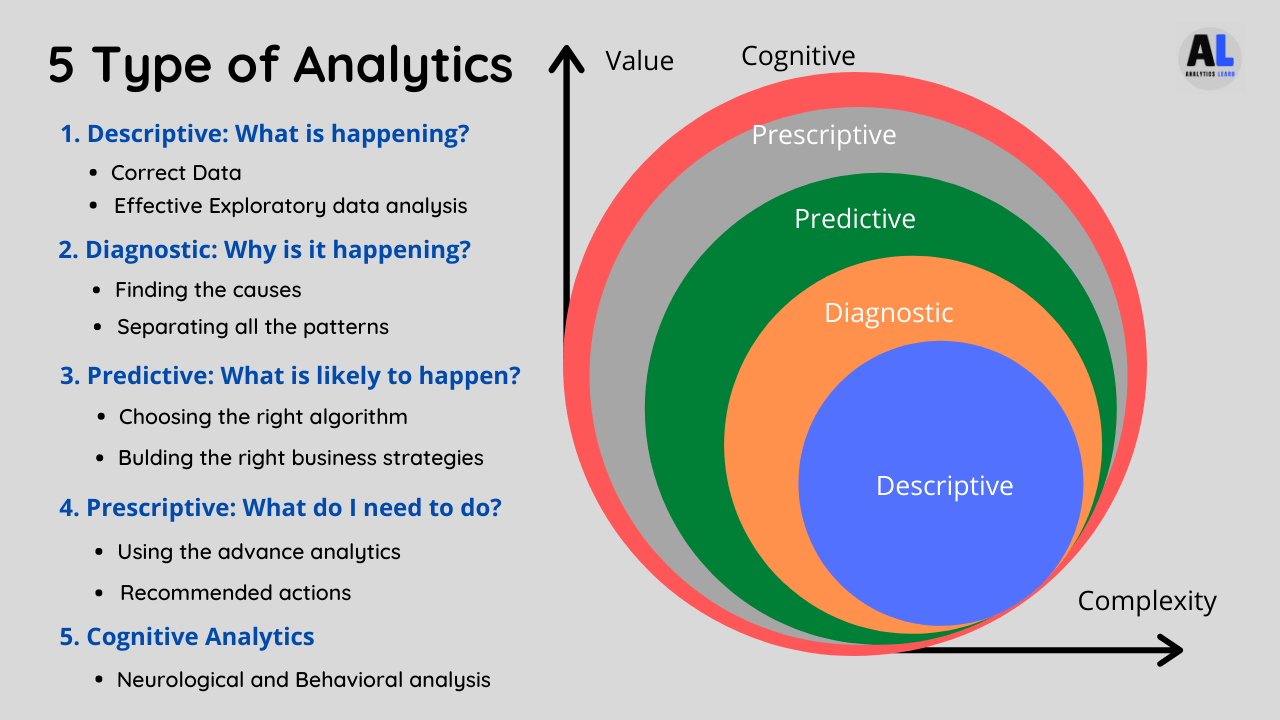
What is Exploratory Data Analysis (EDA)?
Exploratory Data Analysis (EDA) is a crucial step in the data analysis process where you use various techniques to summarize and visualize the main characteristics of a dataset.
The primary goal of EDA is to understand the data’s structure, identify patterns, detect anomalies, test hypotheses, and check assumptions through visual and quantitative methods.
EDA is iterative and often involves going back and forth between different analyses and visualizations.
The insights gained from EDA inform the choice of further statistical analyses, data modeling, and machine learning techniques. By understanding the data thoroughly through EDA, you can make better decisions and build more robust models.
Key Techniques of Exploratory Data Analysis
Here are some key aspects and techniques involved in EDA:
1. Data Summary Statistics:
- Descriptive statistics like mean, median, mode, standard deviation, and interquartile range help provide a quick overview of the data’s central tendency and variability.
- Frequency tables and cross-tabulations can reveal the distribution of categorical variables.
2. Data Visualization:
- Histograms and box plots are useful for understanding the distribution of numerical data.
- Scatter plots help identify relationships between two numerical variables.
- Bar charts and pie charts are commonly used for visualizing categorical data.
- Heatmaps can show correlations between variables.
3. Data Cleaning:
- Identifying and handling missing values.
- Detecting and dealing with outliers.
- Checking for inconsistencies or errors in the data.
4. Identifying Patterns and Relationships:
- Exploring potential correlations between variables using correlation matrices.
- Conducting initial hypothesis tests to see if relationships are statistically significant.
- Using pivot tables to summarize data and explore relationships among different dimensions.
5. Dimensionality Reduction:
Techniques like Principal Component Analysis (PCA) can help in reducing the number of variables while preserving essential information, making it easier to visualize and interpret high-dimensional data.
Key Steps in Exploratory Data Analysis (EDA):
Here are the Key Steps involve in Exploratory Data Analysis (EDA) while dealing with data:
1. Granularity of data

Data for any object or subject shows their quality and values and specific object or subject data comes with certain levels.
Every level of data called the level of information and that information called the granularity of that specific object or subject.
It is a very crucial factor in understanding any object using granularity and it shows you level of detail in data.
We can understand the granularity using a few examples like 1. address can be showing the granularity like block, sector, city, state, country, etc. 2. the time like a millisecond, second, minutes, hours, day, months, quarter, year, etc.
2. Check the Type of Data

The type of data in programming and computer science is define using int, float, char, etc. that call it a data type for execution.
In data analysis, the data type may differ a little which shows the original type of data might be categorical, numerical, date, location, text, URL, Phone No, etc.
Data analysis and modeling need the right data for execution and every algorithm needs a specific type of data for a correct prediction or forecasting.
Sometimes conversion or transformation may require to do optimize the operation and correct results.
3. Reclassify the Data Type

The data sometimes need to classify or reclassify for better analysis you might convert into a numerical or categorical form.
In modern world maximum organization follow data science and AI approach to solve the business problem.
This kind of advanced approach uses machine learning for the business prediction that divides problems into classification and regression problems.
The classification problems need categorical data and regression needs numerical data and if data is not required for then it needs to be converted in the required form.
For example, if you want to classify data based on age but it is in numerical for that you need to convert the age in different ranges using binning (1-25, 26-50,51-75, 76-100) to classify the sale of products.
4. Missing Values Treatment

After performing a data scraping appears with lots of missing values and it is a normal aspect of real-world business and data-related problems.
Understanding the way like how to handle missing values effectively is a challenging step to reduce bias and to produce powerful models.
The Programming languages like R and python offer numerous techniques to implicate missing values or perform NA value treatments.
The missing value treatment processes can differ based on data, you can do an operation like Deleting the observations, Deleting the variables, and Imputation data using mean, mode, median, etc.
The other way for missing value treatment using specific programming libraries which is less recommended but r programming presents tools like kNN Imputation, mice package rpart package, etc.
5. Treating the Outliers

Outliers in data that show something wrong In data or the data points may differ from original data points.
The outliers may affect your analysis and the accuracy of the results from modeling.
Sometimes outliers may come from wrong entry, wrong collection, or Certain intense high and low values in the dataset.
Another factor is that it is mostly proposed by human or mechanical error or at the time of replacing missing values.
You can treat outliers using Mean or Median or using random Imputation, other ways can be Trimming or Top, Bottom, and Zero Coding or using Discretization, etc.
6. Removing the Duplicate Records

The replication of data or the repeated information can create difficulties at the time analyzing the data and this is significant to treat using exploratory data analysis.
While using Scraping tools or programming bots for data collection or automated web scraping can scrape the duplicated or redundant information from the internet.
Removing the unnecessary records from the column can increase the chances of accuracy and performance of the model at the time of data modeling.
7. Feature Selection

Feature extraction and feature engineering do the transformation of raw data into suitable features for correct data analysis or modeling.
Feature selection and Feature transformation do the transformation of data to improve the algorithm’s quality by removing unnecessary features.
The feature selection methods typically offered three categories based on how you can join the selection algorithm and model building.
The exploratory data analysis practices feature selection for relevant purposes and the categories for feature selection are the Filter method, Wrapper method, Embedded method, etc. to improve the feature selection in the Exploratory data analysis process.
8. Univariate Analysis

Univariate analysis is possibly the most simplistic form of statistical analysis that can be inferential or descriptive.
The key point is that a single variable is included in this analysis to understand the weightage and usability of variables in data.
It can mislead the analysis results in some cases so that bivariate or multivariate analysis might be appropriate.
The exploratory data analysis does the Univariate Analysis on every single variable to make the data science process more valid.
The following Exploratory data analysis techniques that utilize a single variable to get the exact matching variable for data science modeling are as follows:
A. Categorical data analysis:
Finding the Frequency distribution on categorical data to check what percentage of levels contribute to 80% of the frequency.
B. Numerical data Analysis:
The statistical plotting like Box plots & histograms to identify distribution and outliers.
C. Text data Analysis:
Bag of words like a word cloud Derive new columns based on top words.
D. Location data analysis:
Get latitude and longitude, and visualize them using APIs.
E. Date data Analysis:
Derive metrics like the year, month, day, weekday, quarter, etc.
For an advanced level of understanding of Analytics read this book – Advancing into Analytics: From Excel to Python and R – Shop Now
Related Article: What Are The Steps In Data Analysis?
9. Bivariate Analysis

In the exploratory data analysis process, you can utilize the approach of bivariant analysis to analyze the two variables or samples at a time to find different statistical measures.
The following statistical analysis can be included in Bivariate analysis to make data valid using this Exploratory data analysis process.
A. Correlation Analysis
The correlation analysis applies to two numerical columns to check whether both columns are positively correlated or negatively.
It also helps to understand the similarity between two columns to get the variance level and relation between two columns.
B. Segmented Analysis
It needs One categorical column & one numerical column for analysis. The Examples are T-test or ANOVA (Analysis of Variance)
C. Crosstab Analysis
It performs on Two categorical columns to check similarities of classes. An example is the Chi-square test
Related Article: What Are The Important Data Analysis Techniques?
10. Multivariate Analysis

Multivariate analysis is the statistical method used to analyze the many variables at a time using various techniques.
The algorithm techniques can be Dimensionality reduction, Clustering, Classification, and discrimination analysis, Multivariate hypothesis testing, etc.
A. Principal component analysis
Principal Component Analysis or PCA is specially used for exploratory data analysis and for predictive models.
PCA is generally applied for dimensionality reduction by calculating each data point into the first few principal components.
This process holds lower-dimensional data to preserve as enough of the data’s variation as possible.
The first principal components can carry more variance that maximizes accuracy and decrease the data load of modeling.
B. Factor analysis
It is a multivariate technique that is used to conquer a large number of variables into several numbers of factors.
The factor analysis technique extracts maximum variance from all variables (columns) and puts them into a standard score.
This analysis process can create an index of all variables and based on scores it’s used for further analysis.
Conclusion
Exploratory Data Analysis (EDA) belongs to the fundamental process of examinations on raw data to distinguish the key patterns from data in the data science process.
This is meant for looking at variations, testing the data using hypotheses, and assumptions using summary statistics and graphical illustrations to increase the chances of good data modeling.
Related Article: What Are The Types Of Data Analytics?

Meet Nitin, a seasoned professional in the field of data engineering. With a Post Graduation in Data Science and Analytics, Nitin is a key contributor to the healthcare sector, specializing in data analysis, machine learning, AI, blockchain, and various data-related tools and technologies. As the Co-founder and editor of analyticslearn.com, Nitin brings a wealth of knowledge and experience to the realm of analytics. Join us in exploring the exciting intersection of healthcare and data science with Nitin as your guide.