

In this article, we are going to discuss detailed information about what is feature Engineering? And how it is useful for machine learning?
Similarly, we will see the exact techniques used in feature engineering to evaluate the right feature (variable/column) for predictive modeling.
Feature Engineering or selection process is not only crucial but also time-consuming in most cases, so before getting deep dive into it let’s understand what is feature engineering.
What is Feature Engineering?
It is a process to select the right feature or variable from complete data that has more relevant unique data for correct modeling.
It is the technique that uses domain knowledge to select features or input variables that help machine learning algorithms to work correctly.
This technique adds more impact to increase the predictive power of any machine learning model.
Feature Engineering is also called applied machine learning because it is time-consuming, feature difficult, and needs good domain expertise.
The features with a huge influence on the performance of the model have high priority in selection.
Some features will be more influential than others on model accuracy, while irrelevant features can increase the complexity of the model and add noise to the data (which can negatively impact model performance).
In addition, features may be redundant if they’re highly correlated with another feature and can be removed from the data set without any loss of information.
How to perform Feature Engineering?
There are some traditional ways (Practices) that are highly used at the time of feature selection and in the maximum cases, these are always the same.
Removing Redundant Feature:
Every data you gather from different sources in that the different variables or data in that variable can be dirty or redundant.
This kind of data needs Feature selection or feature engineering methods to identify and remove redundant features as well as information from the collected data.
This kind of data or features does not contribute to the correct analysis or the accuracy of a predictive model.
Handling the Large Dimensions of Data:
Data has been collected from different IoT devices or from different streaming environments that can large in quantity like big data.
Feature Engineering can help reduce this huge amount of data that contributes to the curse of dimensionality.
A large amount of data like more dimensions (Rows*Columns) with a high correlation and redundant information can leads to overfitting of the model.
Removing the Large Amount of Feature:
Sampling the data or reducing the number of columns from the data through feature selection can decrease the chances of wrong modeling.
It also helps to ensure that the training model will require minimum memory and computational power and it is leading to shorter training times and reduce the common problem of over-fitting.
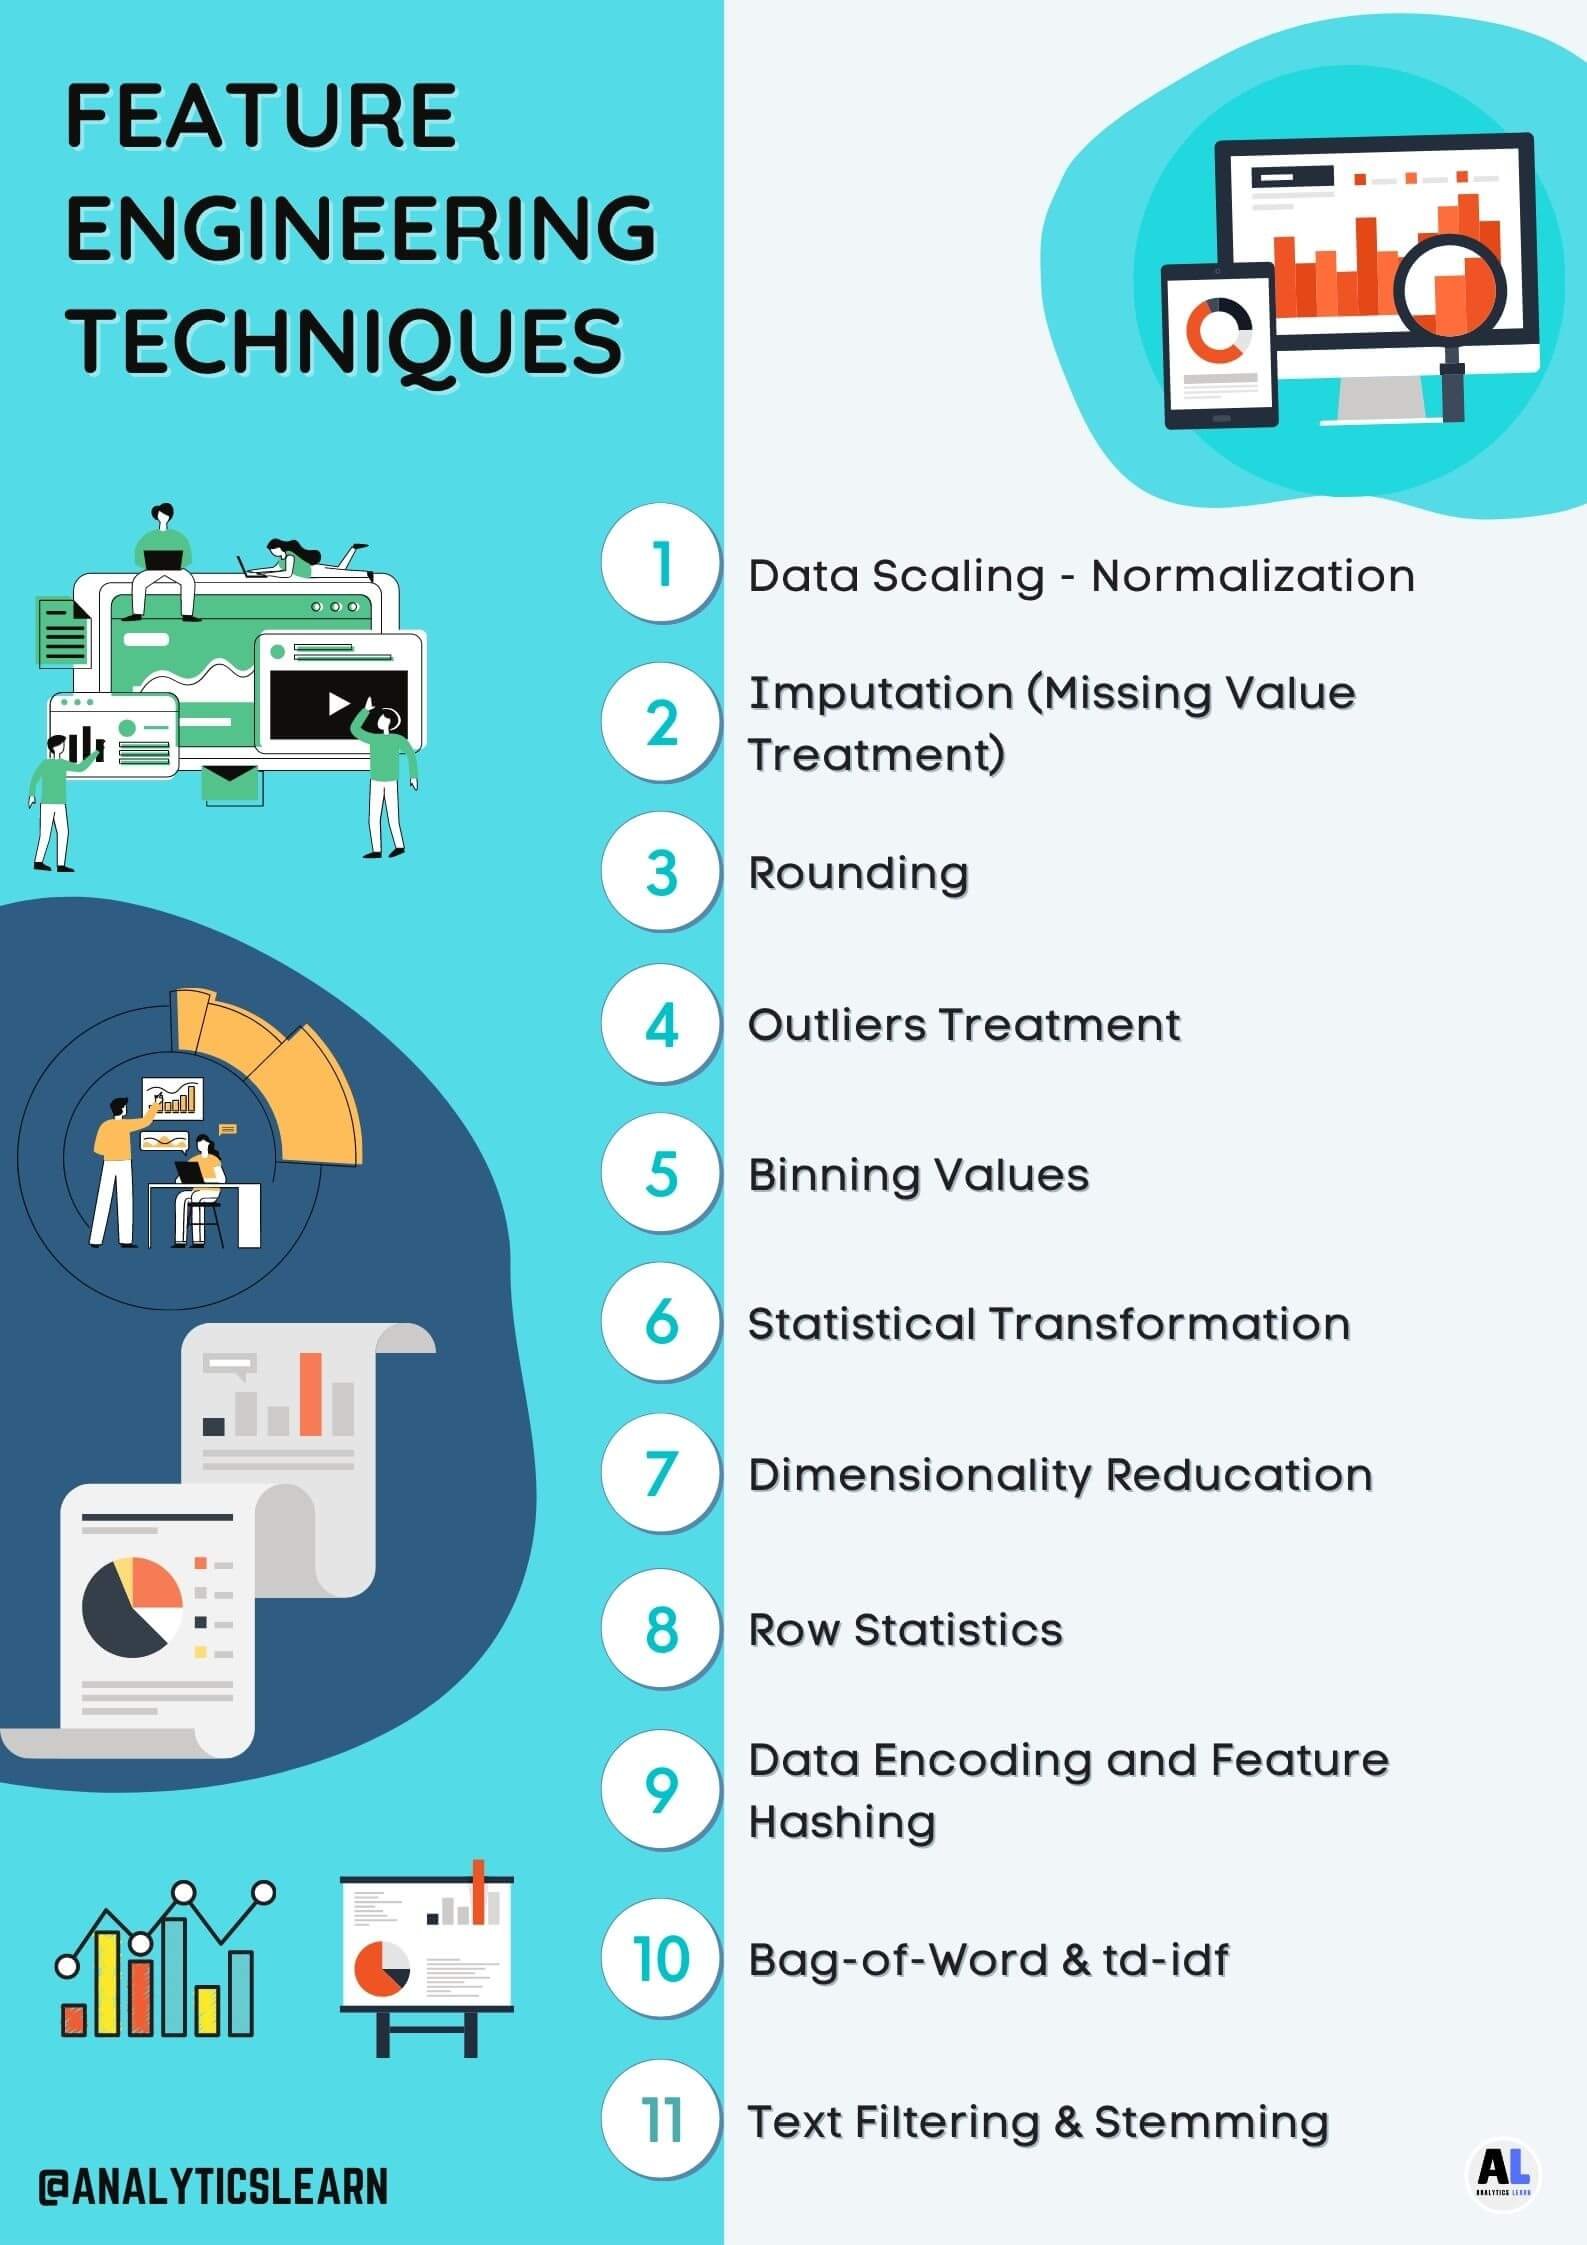
Techniques of Feature Engineering
Feature Engineering on Quantitative Data:
1. Data Scaling
Data Scaling is the transformation process that can perform on various forms of data so that it lies on the same scale.
There are few ways you can scale the data including mean normalization, min-man scaling, z-score Normalization, unit Vector.
• Mean Normalization:
It is the data scaling process to normalize the unbalanced or normalized data in the scales of [–1 to +1] with mu = 0.

It is the first and basic well-known process to normalize the data in feature engineering practices.
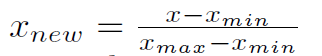
• Min-Max Scaling:
It is another most flexible and easy-to-use normalization process to convert the scales of data between zero to one [0, 1].
It has only one negative point which is that it is not able to handle outliers very properly and in most cases, it misses the data normalization correctly.
• z-score Normalization:
It is another best approach in data scaling to normalize the data on the scale of zero to one with mean is 0 and variance is 1.

While performing a z-score normalization needs the understanding of the mean and standard deviation of the entire data population where a data point fits.
Data scaling using z-score normalization is determined by deducting the mean data from raw data points and dividing the standard deviation.
• Unit Vector:
This normalization technique uses for scaling every single vector in the range of data zero to one data point [0, 1].

Vector normalization is the very crucial and best technique in data normalization that is based on the magnitude and direction of data points.

At the time of data normalization, the vector does the changes in its magnitude and holds the direction as it is and the unit vector is used to create the right direction on data points in the range of zero to one.
2. Data Imputation
It is the missing value treatment process where we impute the missing using some statistical techniques.
The data imputation process makes any dirty data into a well usable feature to perform the right predictive modeling.
It uses multiple techniques to fill values in missing locations using mean, median, mode to get the right model output, etc.
3. Rounding
It is a way to restrict the numerical data at certain decimal points because precision can sometimes be noise, so round data to the nearest integer or decimal can be significant in model building.
To perform the easy rounding process there is a function in python to round the data at the specific decimal points.
4. Outliers Treatment
Data Outliers are the data points that highly differ from the current data points or sample data that can come because of variability in data or the wrong data collection process.
Outliers in data can lead to an error-ness or wrong analytical results or misleading predictive modeling.
That’s the reason detecting and removing the outliers from the data can make data normalized and balance for correct analysis.
This process can perform with the help of mathematical and visual processes using standard deviation like x * std_dev, percentiles, or capping.
5. Binning Values
It is one of the important and best practices while doing feature selection to converting the continuous data into the discrete form.
It is a way to transform the numeric variables into categorical variables. Like there is an age column which you need in the form of a certain range using binning you can convert that in a specific form (e.g. age – 1,3,6,10,12, to 100 can be 1-10, 11-20, 21-30, 31-40, etc.)
6. Statistical Transform
Similar to other statistical approaches to select or create the well-formed feature you can apply another statistical transformation method in feature in engineering.
• Box-Cox Transformation:
The Box-Cox transformation is the statistical approach to convert the un-normalized data into the normal distribution.
Box-Cox transformation first plots the data in the histogram to see the distribution if it is not normal then convert it into Gaussian curve distribution form.
• Log Transformation:
The log transformation is also used for the data transformation process but it uses the log function to make skewed data less skewed
For example, if the future is x and it is highly skewed on the right side and you need to make as less skewed you can use the log function to perform log transformation on the x column like this x_var = log(x).
7. Dimensionality Reduction:
It is the most crucial and highly usable statistical or machine learning technique to make your data correctly normalized and usable for analysis.
It Is focused on reducing a large number of variables from data with the help of Principal Component Analysis, Factor Analysis, and clustering, etc.
8. Row Statistics:
The Row statistics of data introduce features that capture the statistics of a data point and the statistics technique gives instant stat or numeric calculation or summary of rows easily.
The row statistical techniques including mean, median, mode, max, min, etc. can use on multiple or single rows and you can use another statistical task also like finding the missing values count, a number of negative or duplicates of numbers, etc.
Feature Engineering on Categorical Data
We perform the below types of encoding and hashing process to make sure that our data is completely numerical because except few algorithms in machine learning, remaining all the algorithms require numerical data for more accuracy to get the right predictive result.
9. Integer Encoding:
It is a categorical data encoding or conversion process in feature engineering that assigns each category to a unique integer.
This integer encoding method converts each and every categorical word in a specific number like this (e.g. \car”!1, \bike”! 2, \bus” ! 3, etc.)
10. One-Hot Encoding:
It is a data encoding method used to transform data with k categories into a numerical vector of length k containing only one 1 and the rest 0s.
It is also called the dummy variables creation process to convert categorical data into numeric form like zero and one [0,1]
We can represent the multiple categories of data in yes or no form like 1 mean yes and 0 means no.
We have three categories: car, bike, bus and we let the first value in the present vector represent car, a second bike, and third bus; car! [1, 0, 0] and bike! [0, 1, 0], bus! [0, 0, 1].
11. Feature Hashing Scheme:
It is the transformation process to convert features into indices in an m-dimensional vector with the help of applying a hash function to the values.
In simple words, it creates the index from 1 to n based on text in our vector and it follows the approach of text classification like bag-of-words and TF-IDF to construct the dimension of the vector.
Feature Engineering on Text Data
12. Stemming:
The data steaming process is utilized in text analysis and particular in sentiment analysis to understand the right sentiments from data.
It uses the way to clean or convert each word in the text data down to its basic linguistic word stem form like a word called talk which you can get from talking, talked talker all forms of the world.
13. Filtering:
Text Data filtering is the process to filter data based on words that are not necessary or useful for analysis.
The text data contain a large amount of noise that needs to remove, such as stop words like most of the common words that don’t add value to the sentence.
Similarly in text filtering, you can find and remove rare words that are not very impactful if the model sees some non-useful words once or twice.
14. Term-Frequency-Inverse Document Frequency (TF-IDF):
It is similar to a bag of words but this process follows the very peculiar approach to perform the right text analysis.
Similar to bag-of-words but instead of taking the raw counts, each raw count is multiplied by the number of documents in the dataset divided by the number of documents the word appears in.
15. Bag-of-Words:
It is the collection of words with the respective count that use to represent the maximum count of a specific word in data like the small car is coming towards me and the car is red ( f\Car: 2, \is: 2, \coming: 1, \towards 1, \red:1, etc.)
There are other ways also to represent the bag of words like bag-of-n-gram, bi-gram, tri-gram, etc. to make tokenization of data easy.
16. Bag-of-n-grams:
It is a collection of words in repetition similar to a bag or words it is a bag of multiple words called n-gram or Bag-of-n-grams.
It is a continuous set of items from a text, where items can be letters, words, phonemes, syllables, or small sentences, etc.
The bag-of-n-grams can bi-grams, tri-grams, or n-grams which can use to tokenizing and performing topic modeling or sentiment analysis.
Conclusion
Feature selection or feature engineering is the one and the only approach to make your data pure and standardized to get expected or correct predictive modeling and analysis results.
It uses and follows several methods and techniques to convert your data in clean and structured form those we have already seen above.
Understanding all the feature engineering techniques can make you aware of the normalization techniques, the difference between balanced and unbalanced data, and other statistical implementations on data.
Recommended Articles:
How To Do Data Normalization For Machine Learning?
What Is A Statistical Model? | Statistical Learning Process.
What Are The Types Of Machine Learning? – In Detail
Gradient Descent Derivation – Mathematical Approach In R

Meet our Analytics Team, a dynamic group dedicated to crafting valuable content in the realms of Data Science, analytics, and AI. Comprising skilled data scientists and analysts, this team is a blend of full-time professionals and part-time contributors. Together, they synergize their expertise to deliver insightful and relevant material, aiming to enhance your understanding of the ever-evolving fields of data and analytics. Join us on a journey of discovery as we delve into the world of data-driven insights with our diverse and talented Analytics Team.


