This article describes how to use Support Vector Machine in machine learning, along with SVM free online Guide in detail, so you can decide if this technique is right for your problem set.
Data analytics have become increasingly important to the world of business, and it’s easy to see why; if you can use the information at your disposal to make smarter, more informed decisions, you’re probably going to be better off in the long run.
That’s where support vector machine (SVMs) come in, as they are one of the best tools out there when it comes to analyzing data, especially in fields like medicine and finance that often deal with large amounts of data that needs to be analyzed quickly and accurately.
This beginner’s online guide to support vector machine will help you understand why they are used, what they are used for, how they work, and what the future holds for them in real-world applications.
What is Support Vector Machine?
SVM is a machine learning method that analyzes data and determines whether it should be classified as positive or negative.
There are two types of SVMs, linear and non-linear, but we’ll focus on linear for now. Linear SVMs examine data for an optimal line of separation (i.e., a margin) that categorizes positive from negative data most effectively.
In plain language, SVM identifies the line between good and bad so that you can tell what belongs to each category.
If you want your business to succeed, then you need to know how SVM works and how it can benefit your company.
You also need to know how it compares with other machine learning methods such as neural networks, logistic regression, and random forests.
Different Types of SVM
There are two types of SVM:
The first one is called a soft margin support vector machine (SMSVM).
Another type of SVM is called a hard margin support vector machine (HSMSVM).
In an SMSVM, each data point has an additional weight associated with it and contributes to how close that data point will be to its cluster.
An HSMSVM assigns only two categories, each of which has discrete weights. HSMSVM is more popular in practice than SMSVM because there is less inter-classification error when working with continuous variables, For example, say we have five different colors: green, red, blue, yellow, and purple. An SVM outputs a map of the sorted data with margins.
Similarly, There are two types of SVMs, maximal margin and non-maximal margin, which categorize data differently, which are similar like SMSVM, HSMSVM.
In the maximal margin, data is categorized based on maximizing how different each point is from its closest neighbor; as its name suggests, it does not matter if there are any points between these neighbors.
In the non-maximal margin, classifying data first requires determining potential middle points by looking for ones that have more neighbors closer to one class than another.
Points near these middle points (but not necessarily exactly on them) become part of whichever category has more neighboring middle points around them.
Related Article: What are the Types of Machine Learning? – in Detail
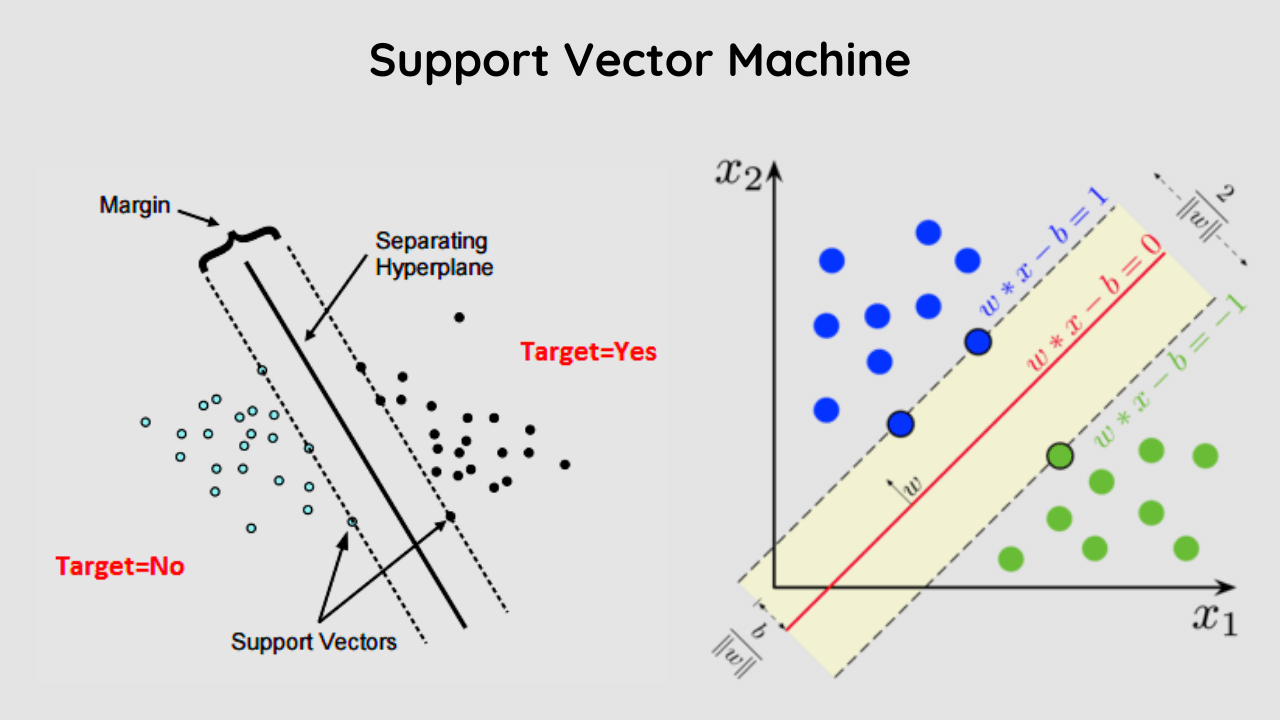
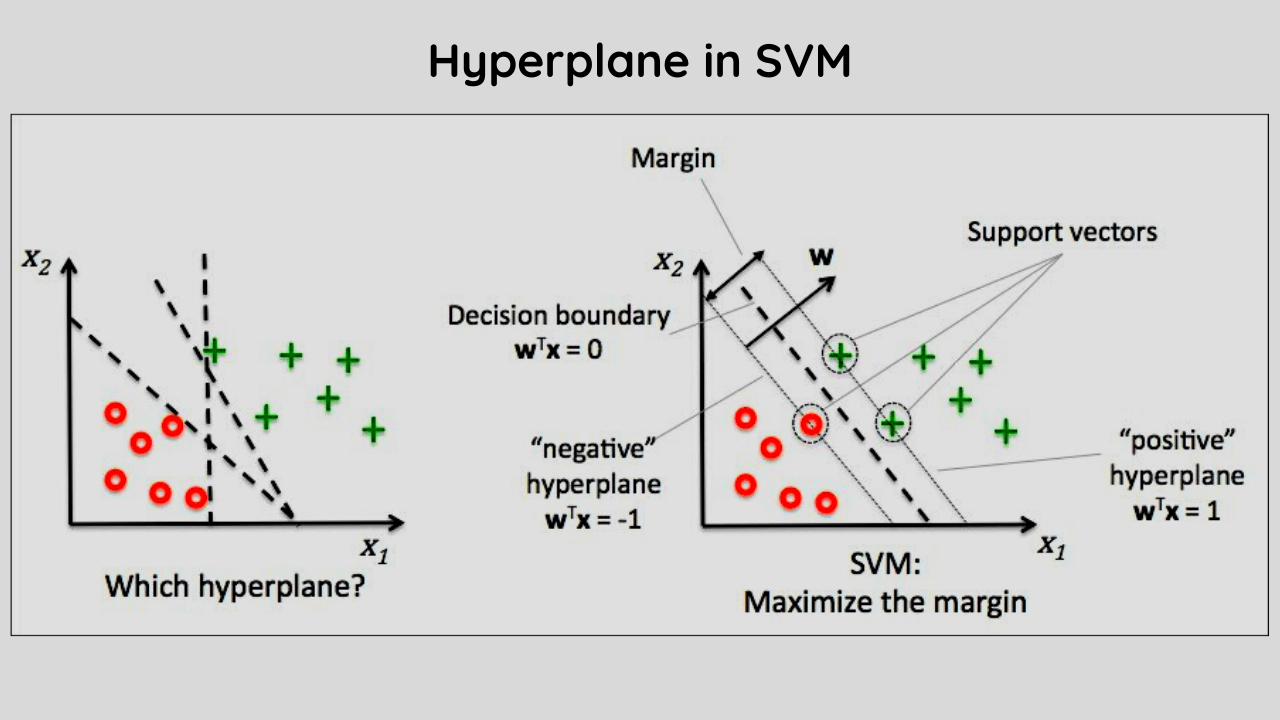
Hyperplane in SVM
The most important concept in SVM is a hyperplane which is a line passing through the origin.
Hyperplane can be used to partition data into two sets i.e. one side of hyperplane and another side of hyperplane, using it for classification or regression analysis.
We call one side of the hyperplane a positive and another side we call a negative set. In our example, we will see how to use these types of hyperplanes for classification purposes.
Assume that given training examples and their respective labels, as an output we need to build a classifier that predicts whether a new unseen sample belongs to class +1 or -1.
If we look at all points in an infinite-dimensional space then each point can be represented by its coordinates (x_i, y_i).
Training examples are plotted on a feature space as shown below where features are x-axis and y-axis coordinate values of training samples.
As defined above features are real-valued attributes whereas labels are binary values that indicate some category membership such as +1 or -1.
Support Vector Machines (SVM) In machine learning is a classification algorithm used for both supervised and unsupervised learning.
The SVM uses points that are closest to separating hyperplanes as support vectors in order to find non-linear boundaries.
The hyperplane is a special case of multiple linear regression with just one independent variable.
Because SVMs can deal with non-linear problems, they are widely used as kernel methods and have excellent empirical performance on many problems.
How does SVM works?
To classify something basically means to identify it as belonging to one or more categories.
And how do we determine whether something belongs to one category or another? We compare its features with those of other items.
For example, if we wanted to know whether someone was male or female, we might compare their height and weight against average measurements for men and women.
If they met our criteria for males, then that would be our classification but if not, then they would be classified as female instead.
This method might seem incredibly rudimentary but you can imagine how much more complicated things get when we start talking about whole sets of measurements including information like medical history which isn’t measurable at all!
A support vector machine is a supervised learning method that looks at data and sorts it into one of two categories.
An SVM outputs a map of sorted data with margins and classifications, The software works like a large number of math equations that solve for values that are neither too high nor too low, but just right.
When do you need a Support Vector Machine?
The first step in using SVM is to figure out when you need one, This is a somewhat complex problem, but there are two main factors to consider.
First, check this properly what type of data do you have? Second, what kind of results do you want? These questions will guide your decision on which algorithm to use.
The simplest method of classifying data is with a Bayesian classifier, The output can be used as a map that shows where certain classes exist in your training set.
If you’re looking for linear separability, though, then SVMs are often more useful.
They work by trying to find lines or planes (called ‘hyperplanes’) between points in feature space that separate groups of training examples as much as possible.
Related Article: What is Statistical Modeling? – Use, Types, Applications
Support Vector Machine Implementaion Steps
Step 1: In Python, SVM is implemented as a built-in library called sklearn, If you’re using Anaconda Python, run conda install scikit-learn from your terminal.
Step 2: SVM is a supervised learning method hence, it requires training data along with their labels (e.g., 1 for blue and 0 for red).
It can be used for classification or regression (or both). For example, let’s look at some vector data: Let X = [2 3 6 5 4] and Y = [4 5 3 6 2].
We have four sets of input here: x1, x2 , x3, and x4. Each represents an independent variable (which may also be called a feature set) that we feed into an algorithm.
X consists of four features, each having two possible values represented by 0 and 1. Similarly, y has two features (y1 and y2 ), which also possess two values each.
The objective of our analysis is to determine whether x1, x2, x3, and x4 cause any changes in y.
This will help us make better predictions about future instances. There are many different algorithms that support binary SVMs, but we’ll use linear SVM since there are fewer terms involved.
Step 3: we need to set up our environment first to import necessary libraries and function definitions, Then write a function to convert input data into arrays so that they can be stored in NumPy arrays.
Step 4: Now, let’s declare our variables and load test data for simplicity purposes, we will assume only two classes.
Now, let’s instantiate an object of class SVM from sklearn: As mentioned earlier, SVM can handle both regression problems (predicting continuous numbers) and classification problems (predicting discrete numbers). So select either one based on your problem type.
Step 5: The next step is to provide parameter types needed to construct an SVM model in Python.
Step 6: It’s pretty important to choose the appropriate kernel type and gamma value because too high a gamma value might result in underfitting while too low a value might result in overfitting resulting in bad generalization capability.
Here, we’ve chosen the Gaussian radial basis function (RBF) with the default RBFkernel (gamma=0.001 ).
Step 7: Once you have selected all other parameters for constructing the SVM model, simply call fit()
Step 8: Though now your model is trained, it still needs to be evaluated against validation data before finalizing.
Evaluation functions are provided by the SVM module of sklearn and you simply need to call predict() to evaluate performance.
To evaluate performance, we’ll separate our data into 80% for training and 20% for testing, However, if you want to see how good your model is against unseen data, try splitting them 50:50.
To evaluate your model against unseen data (i.e., the accuracy of your SVM model), simply pass a whole new array of data (of the same length) to predict.
Under such conditions, most models have around 95% accuracy, depending upon the size of the dataset.
Learn more about support vector machine online on the Kaggle platform in detail with the python examples.
Simple Implementation of SVM in R
This is a simple example of a support vector machine you can learn deeply about SVM implementation in R on the Kaggle online platform.
library(e1071)
data(iris)
svm_fit <- svm(Species~., data=iris, kernel=radial)
plot(svm_fit)
table(predicted = svm_fit$decision.values, actual = iris$Species)
Predicted classified as follows and validate the model based on below points:
- 0 indicates Setosa, 1 indicates Versicolor, and 2 indicates Virginica.
- True Positives indicate instances where an instance was correctly predicted.
- False Positives indicate instances where an instance was incorrectly predicted.
- True Negatives indicate instances where an instance was correctly not predicted.
- False Negatives indicate instances where an instance was incorrectly not predicted.
How do SVMs learn?
An SVM uses a learning algorithm called a kernel function, which defines how points in input space will be mapped into an output space, A common way of doing that is to use polynomial or radial basis functions (RBFs).
An RBF has special properties that make it useful for feature mapping with SVMs: It maps vectors into high-dimensional spaces where they can be linearly separated from each other. Another important concept when using SVMs is the margin.
Margin refers to how far apart data points are from their nearest neighbors within a class and thus helps determine which category new data should belong to.
In order to classify something as one category versus another, you need enough separation between them.
Where can I use SVMs?
The first applications of SVMs were in fields such as medicine and biology, where researchers wanted to sort cells into healthy or cancerous.
Today, SVMs are used for a wide variety of machine learning applications, such as spam detection and computer vision.
Because they’re relatively straightforward to implement and can be incredibly accurate SVMs are one of today’s go-to data analysis techniques.
For example, we use them at Sortable to identify whether an email is a spam or not spam with extremely high accuracy (99%).
Future Trends in Support Vector Machines
Machine learning is one of those things that has really taken off as of late. We’re still just starting to scratch the surface of what we can do with machine learning, but it’s already shown us that there are plenty of ways for it to change our world for better or worse.
Support vector machines are a big part of all that and it’s predicted that support vector machines will drive a lot of future trends for data mining and machine learning.
It won’t be long before SVM becomes an absolutely essential tool for enterprises that want to stay competitive when it comes to predicting customer needs and wants.
SVM technology will grow increasingly important as customers become more demanding of companies they buy from both in terms of speed and quality.
With support vector machines being one of their best options for staying competitive, we can expect things like enterprise AI and machine learning with support vector machines are likely to really take off during 2017–2020.
As we move into 2020 there are several big trends that we’ll start seeing emerge, Data Science is becoming a lot more popular.
Conclusion
SVM makes it possible to analyze huge amounts of data in less time than other methods, but if you’re not careful, you can end up with a training set that’s skewed.
With SVM, it’s easy to get false positives and negatives when analyzing new data sets. Another problem is multicollinearity.
When two or more independent variables are highly correlated with each other, it leads to poor models that lack accuracy and precision.
Related Article: Boosting Machine Learning Algorithm – Complete Guide

DataScience Team is a group of Data Scientists working as IT professionals who add value to analayticslearn.com as an Author. This team is a group of good technical writers who writes on several types of data science tools and technology to build a more skillful community for learners.