For today’s business growth following the right Steps In Data Analysis gives better results in business and money growth.
The major and the most required part of the Data Analysis is the business problems and the required data.
What data you require, why data require, and How you can get that data for the data science process.
Understanding of business domain and data sources has essential begore starting a data science process.
You will be able to identify the steps in the data science process here and understand what each step involved.
- Data Collection (Gathering)
- Data Understanding (Exploration)
- Data Processing (Data Transformation)
- Data Analysis (Modeling)
- Data Visualization (Communicate result)
- Utilizing the result for Actions
The Detail Steps In Data Analysis.
Let’s now look into the basic steps In data analysis and everyone keep applies some or all of these steps in all of the case studies of data science.
1. Data Acquiring (Collection)

Data Acquiring includes multiple things that retrieve data like finding, accessing, acquiring, and moving, etc.
Acquiring and scraping the data involves the identification of verified access to all data and its sources are these steps make the data analysis easy.
Transportation of the data from different sources, and the ways to subset and match the data to regions.
The different types of techniques and technologies used to access and retrieve the data for the data science process.
We get data from several platforms like There might be multiple sources of data including different ways to access data.
The process called Data Collection follows a few steps like Identifying, Retrieving, and Query data.
2. Data Exploring (Understanding)

Understanding of data is the primary goal of data exploring you can use Correlations, General trends, Outliers from data exploring.
Exploring data is to understand what type of data you have collected, and how you can prepare it for analysis.
It needs a decent understanding of statistics and visualization methods, these are the Important methods to perform a preliminary analysis.
Data Exploring can possible using statistical techniques like mean, median, mode, range statistics to describe your data.
To Understand your data you can Visualize using Histogram, Scatter plots, Boxplots, Line graphs, Boxplots, which are the crucial steps in data analysis.
3. Data Pre-Processing (Preparing)

Data Processing helps to Identify the problems with real-world data and define the required transformation of raw data.
The data processing steps involve data cleaning, data transformation, subsetting or filtering data, and creating data, etc, executes data analysis efficiently.
Formatting of data requires addressing quality Issues, remove missing values, merge duplicate records, generates the best estimate, and Remove outliers.
Data cleaning implement things like removing Inconsistent values, Duplicate records, Missing values, Invalid data, and outliers treatment.
Data preparation and data transform are very important for meaningful steps in preprocessing for the analysis of data.
For multiple datasets, Data preprocessing do the integration of raw data from different data sources or streams.
4. Data Modeling (Analysis)

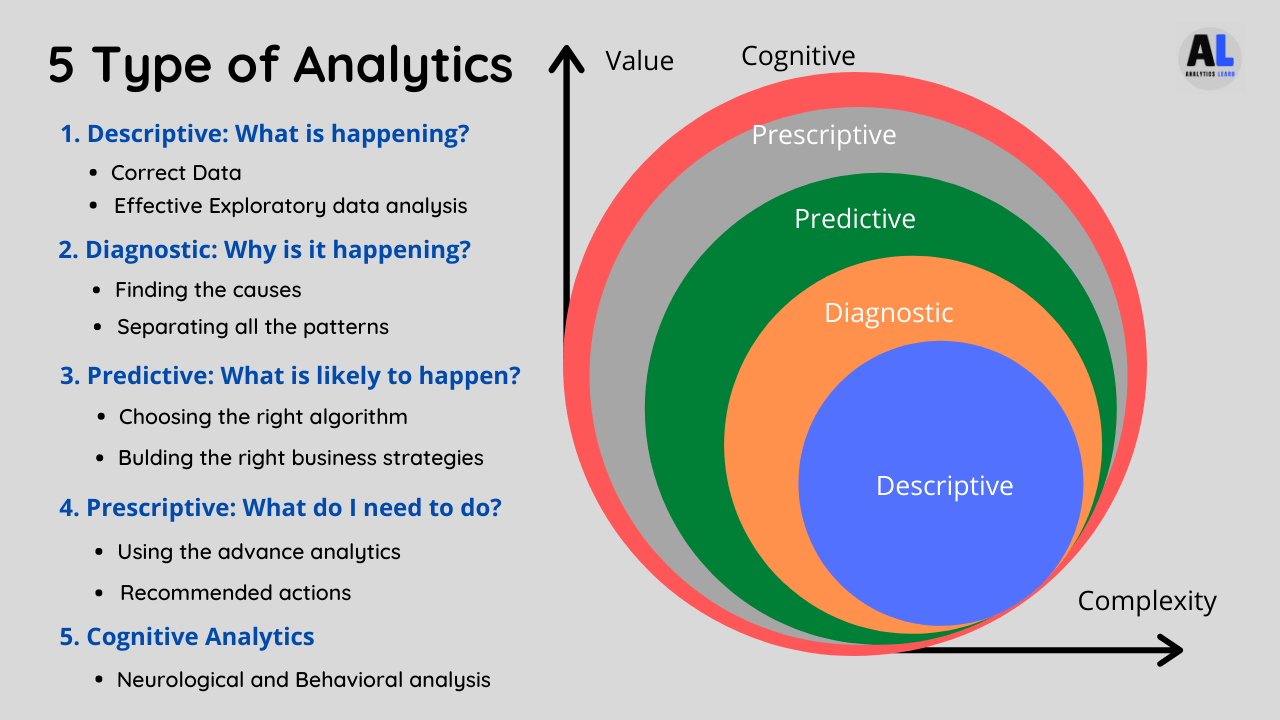
The prepared data passes onto the analysis step which involves the selection of modeling and analysis techniques.
The analytics techniques are used to build a predictive model (algorithm) on the data for prediction and data analysis.
Data Analysis iterate the analytics process to check steps one and two to get the data in the correct form.
Selecting the right analytical techniques to build a correct model requires a decent understanding of data and mathematical practices.
Few Categories of Analysis Techniques like Classification, Regression, Clustering, Association Analysis, and Graph use base on the business problem.
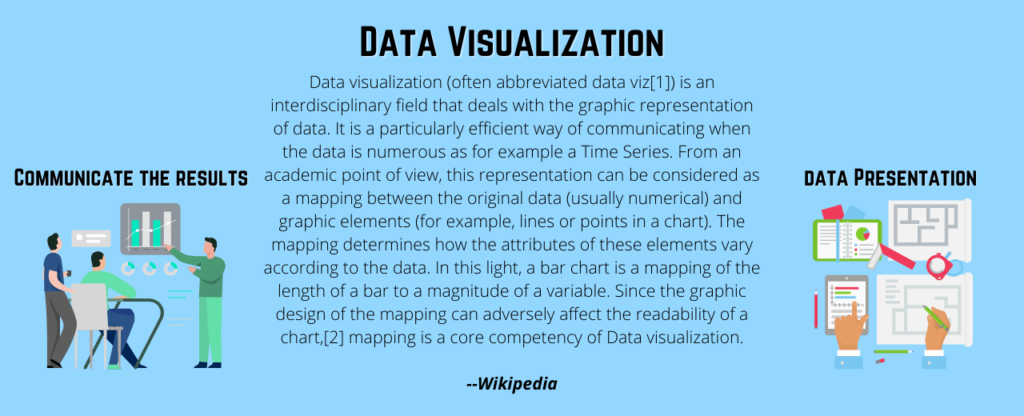
5. Communicate Results (Visualization)

Communication of the analyzed rules is a complex responsibility and few notable points come at a time of result communication step like What to Present? and How to Present?
There might not be simple to answer these questions like What and how we can communicate the results.
The significate factor of visualization is What to present? and if you get that then the required result you can get from the analytics part.
In that mostly include what you have predicted or what you got from data in the data analytics phase.
the next question comes is how to present? that offers a simple procedure where you can use visualization tools or programming.
The visualization part helps to create charts and plots to understand the analysis of data for right decisions making.
6. Turning Insights into Action

Turning insights into action means connecting your results with your business problem and how it going to help solve the business needs.
The steps like the Implementation of results and insight actions that you got from the data analysis need to execute wisely.
How to automate the analysis process for saving cost Automation, Stakeholders for business growth, etc.
Reporting insights from analysis and determining actions from insights based on the idea of the acting step in data science.
Conclusion
In this article, we have explored all of the steps in a typical data analysis that can solve any business problem smoothly.
Data operates with advancements and changes from one step to different for more reliable business decisions.
It is an iterative process that means findings one step that may require previous steps to process data.
Every step in the analytics process is get repeated with new information, and that is the science similar to analytics in the data science process.
Recommended Articles:
How To Do Data Processing For Analysis?
What Are The Simple Steps For Web Scraping?
What Are The Important Data Analysis Techniques?
Data Understanding For Data Science – Detail Explained

Meet our Analytics Team, a dynamic group dedicated to crafting valuable content in the realms of Data Science, analytics, and AI. Comprising skilled data scientists and analysts, this team is a blend of full-time professionals and part-time contributors. Together, they synergize their expertise to deliver insightful and relevant material, aiming to enhance your understanding of the ever-evolving fields of data and analytics. Join us on a journey of discovery as we delve into the world of data-driven insights with our diverse and talented Analytics Team.


