In this blog, we are going to explore the list of 50 Power BI interview questions with detailed answers and examples.
This Top 50 Power BI Interview Questions and Answers: Beginner Level” is a valuable resource designed to help individuals who are new to Power BI prepare for job interviews in the field of business intelligence and data analytics.
This collection of questions and answers provides a solid foundation for beginners, offering insights into essential Power BI concepts, such as data import, modeling, visualization, and basic DAX calculations.
The Interview questions and answers are accompanied by a concise and understandable response, making it accessible for those with limited experience in Power BI.
Whether you’re a recent graduate or transitioning into a new career, this resource will help you build confidence and readiness for your Power BI interview, ensuring you can tackle the fundamental concepts and demonstrate your potential as a beginner in the field.
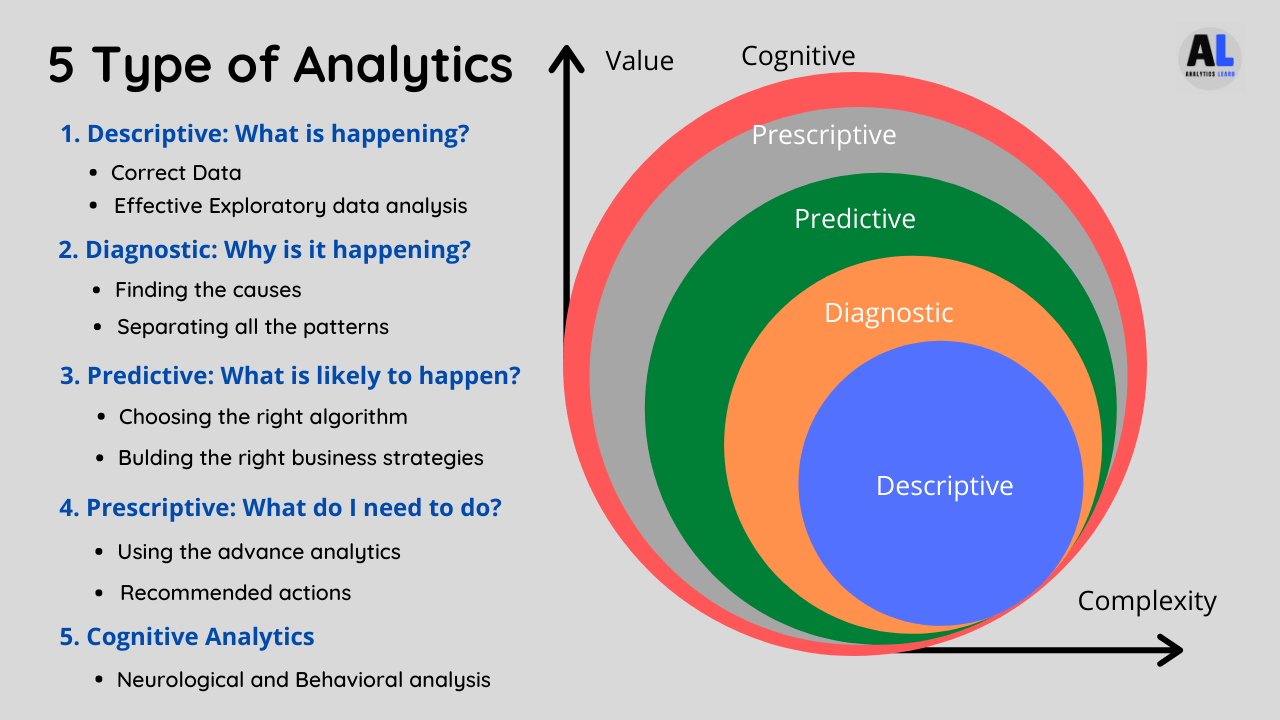
Related Article: What is Exploratory Data Analysis? | EDA in Data Science
Top Power BI Interview Questions and Answers
Top 50 Power BI Interview Questions and Answers for Beginner Level is a concise guide designed to assist beginners in Power BI by providing essential interview questions and straightforward answers to help them prepare effectively.
1. What is Power BI?
- Power BI is a business analytics tool by Microsoft that provides interactive visualizations and business intelligence capabilities with an interface simple enough for end users to create their reports and dashboards.
2. What are the key components of Power BI?
- Power Query, Power Pivot, Power View, Power Map, and Power Q&A.
3. What is Power Query?
- Power Query is a data transformation tool in Power BI used to connect to various data sources, clean and shape data, and load it into the data model.
4. How can you import data from different sources in Power BI?
- You can import data from sources like SQL databases, Excel files, web services, and more using the “Get Data” option in Power Query.
5. Explain the concept of Data Modeling in Power BI.
- Data modeling involves creating relationships between tables, adding calculated columns, and defining measures to build a data model for reporting.
6. What are calculated columns in Power BI?
- Calculated columns are columns created using DAX expressions, which calculate values for each row in a table.
7. What are measures in Power BI?
- Measures are DAX expressions that provide aggregated values based on calculations such as sums, averages, or percentages.
8. What is DAX, and how is it used in Power BI?
- DAX (Data Analysis Expressions) is a formula language used for creating custom calculations and aggregations in Power BI. It’s used in calculated columns and measures.
9. How do you create a calculated column in Power BI?
- You can create a calculated column by selecting the table, clicking “Modeling” in the ribbon, and then selecting “New Column” to enter a DAX expression.
10. Can you explain the difference between calculated columns and measures?
- Calculated columns are computed at the data import stage, and their results are stored in the data model. Measures are calculated on the fly during report visualization and don’t consume memory.
11. What is a filter context in Power BI?
- Filter context is a set of active filters that affect the calculation of DAX expressions. It includes filters from slicers, visuals, and relationships.
12. Explain row context in Power BI.
- Row context is a context that is applied to each row of data when evaluating DAX expressions, making it ideal for calculated columns.
13. How can you create a relationship between tables in Power BI?
- You can create relationships by defining common fields between tables and setting their relationships in the “Model” view.
14. What is the difference between a one-to-one and one-to-many relationship in Power BI?
- A one-to-one relationship means that each row in one table matches one row in the other table.
- A one-to-many relationship means that one row in one table can match multiple rows in the other table.
15. Explain the difference between a calculated column and a calculated table.
- A calculated column is a new column in an existing table, while a calculated table is an entirely new table created with DAX expressions.
16. What is the Power BI Desktop and how does it differ from Power BI Service?
- Power BI Desktop is used for report authoring, while Power BI Service is a cloud-based platform for sharing and collaborating on reports.
17. How do you create hierarchies in Power BI?
- Hierarchies can be created by selecting multiple fields in a table and right-clicking to choose “Create Hierarchy.”
18. What are the different types of visuals in Power BI?
- Bar charts, line charts, pie charts, tables, maps, cards, and many more.
19. What is a slicer in Power BI?
- A slicer is a visual that allows users to filter and slice data by selecting specific values.
20. How do you create a calculated table in Power BI?
- You can create a calculated table by clicking on “Modeling” in the ribbon and selecting “New Table” to define a DAX expression.
21. What is a measure table in Power BI?
- A measure table is a table that contains calculated measures. It’s often used to organize and manage measures efficiently.
22. Explain the concept of Power Query M language.
- Power Query uses the M language for data transformation. It’s a functional language that allows you to perform data operations.
23. What is DirectQuery in Power BI?
- DirectQuery is a data connection mode that allows Power BI to send queries directly to the source database, avoiding data import.
24. What is the difference between calculated columns and calculated tables in Power Query?
- Calculated columns are created at the data model level using DAX, while calculated tables are created at the data source level using Power Query’s M language.
25. How do you implement row-level security in Power BI?
- Row-level security can be implemented by defining roles and filters in the Power BI Desktop and assigning roles to users in Power BI Service.
26. What is the purpose of Power BI Gateway?
- Power BI Gateway is used to connect Power BI to on-premises data sources for data refresh and DirectQuery.
27. How can you use parameters in Power Query for dynamic data loading?
- You can use parameters in Power Query to make data loading more dynamic, allowing users to change query parameters at runtime.
28. Explain the concept of custom visuals in Power BI.
- Custom visuals are third-party or custom-developed visuals that can be added to Power BI to extend its visualization capabilities.
29. What is the difference between a calculated column and a calculated field in a measure?
- A calculated column is created in the data model using DAX and is stored in the data. A calculated field in a measure is used for aggregations within the measure.
30. How do you create a custom measure in Power BI?
- Custom measures are created using DAX expressions. You can define them in the “Modeling” tab in Power BI Desktop.
31. Explain the use of the “SUMX” function in DAX with an example.
- “SUMX” is used to iterate over a table and calculate the sum of a specific expression for each row.
- Example:
Total Sales = SUMX(SalesTable, SalesTable[SalesAmount]).
32. What is the “ALL” function in DAX, and how is it used?
- The “ALL” function removes filters from a table or column, allowing you to perform calculations without certain filters.
- Example:
Total Sales (All Products) = CALCULATE([Total Sales], ALL(Products)).
33. How do you create a custom hierarchy in Power BI?
- Custom hierarchies can be created by selecting fields and creating a hierarchy in the “Fields” pane.
34. What is the “SWITCH” function in DAX, and when is it used?
- The “SWITCH” function is used to evaluate a series of conditions and return different values based on those conditions.
- Example: `Discount = SWITCH(TRUE(), Sales Amount > 1000, 0.1, SalesAmount > 500, 0.05, 0)`.
35. How can you create a custom tooltip in Power BI?
- Custom tooltips can be created by defining them in the “Tooltip” field in the “Visualizations” pane.
36. Explain the use of bookmarks in Power BI.
- Bookmarks allow you to capture the current state of a report page, including filters, slicer selections, and visual interactions, and then revisit that state later.
37. What is Power BI’s Quick Insights feature?
- Quick Insights is an automated analysis feature that provides insights and patterns in your data by automatically creating visuals and asking questions about your data.
38. How do you schedule data refresh in Power BI Service?
- Data refresh can be scheduled by configuring a data source, setting up a gateway, and defining a refresh schedule in the Power BI Service.
39. What is Power BI Publish to Web, and when should it be used?
- Power BI Publish to Web is a feature that allows you to create a public URL for a report.
- It should be used when you want to share reports publicly, but with limited security.
40. How can you secure sensitive data in Power BI reports?
- Sensitive data can be secured by implementing row-level security, using Power BI’s security features, and managing permissions in Power BI Service.
41. What is a drill-through in Power BI, and how is it configured?
- Drill-through allows users to navigate from one report page to another to view details.
- It can be configured in the “Action” settings of a visual.
42. Explain the difference between a calculated column and a calculated measure in terms of performance.
- Calculated columns can consume more memory as their values are precomputed, while measures are calculated on the fly and are generally more memory-efficient.
43. What is a Power BI template and how is it created?
- A Power BI template is a file containing a report structure without data. It can be created by saving a report as a template and then using it as a basis for new reports.
44. How can you use the Power BI REST API for automation and integration?
- The Power BI REST API allows programmatic access to Power BI functionality, enabling automation, integration, and the creation of custom solutions.
45. What is Power BI Apps and how are they used?
- Power BI Apps are collections of dashboards, reports, and datasets that you can package and distribute as a single content pack.
46. Explain the difference between Power BI Pro and Power BI Premium licensing.
- Power BI Pro is for individual users, while Power BI Premium is a capacity-based model that allows sharing reports with a broader audience.
47. How do you implement a custom color palette in Power BI?
- Custom color palettes can be defined by going to the “Themes” settings in Power BI Desktop and specifying custom colors for various elements.
48. What is the Power BI API for embedding reports, and how does it work?
- The Power BI Embedded API allows you to embed Power BI reports in custom applications, websites, and portals.
49. How can you optimize Power BI report performance?
- Performance can be improved by reducing the number of visuals, optimizing DAX calculations, and using aggregations.
50. Explain the concept of the “Dataflow” feature in Power BI.
- Dataflows allow you to create, manage, and reuse ETL (Extract, Transform, Load) logic and data preparation steps across multiple reports and datasets.
Conclusion
These interview questions cover a wide range of topics related to Power BI, including data modeling, DAX, visualization, security, and advanced features.
Be prepared to provide detailed responses and examples during your interview.
Related Article: Power BI: How to Create a Dashboard in It?

Meet Nitin, a seasoned professional in the field of data engineering. With a Post Graduation in Data Science and Analytics, Nitin is a key contributor to the healthcare sector, specializing in data analysis, machine learning, AI, blockchain, and various data-related tools and technologies. As the Co-founder and editor of analyticslearn.com, Nitin brings a wealth of knowledge and experience to the realm of analytics. Join us in exploring the exciting intersection of healthcare and data science with Nitin as your guide.