Exploring the particular data is the process of data understanding for a data science project or analysis using various tools and statistical methods.
What this data about? and Why this data is important? these are the best question before exploring the specific data before solving performing the data understanding process.
What is the data Understanding process?
Understanding of data can be the first step towards data analysis after getting the data, It can be a significant part of data preparation.
What do you understand by data? this is the valid point after using all the data understanding techniques which makes exploring the process very easy.
All the statistical processes can define or describe the essence of data exploring and identify methods to perform a preliminary analysis of data.
Why we need a Data understanding process?
The right data understanding can lead to an accurate analysis result without spending more time on the processing of data.
Similarly, it helps to reduce the time and effort while doing data processing or preprocessing tasks on explored data.
Another benefit of right data understanding can get into different other business problems and it increases the chances of more diverse ideas and optimize solution about business.
How to perform data understanding?
In this process, you need to do some investigation to obtain satisfactory results, information, and the expected characteristics of the data.
In data understanding, you probably need to do precise things like finding the correlations, general trends, outliers, etc. from data.
These are the statistical process and techniques which are very significant and without the statistical process, you can not use the collected data effectively.
Following are the important steps that you need to apply for an effective and easy data understanding procedure.
- Getting the summary statistics of data
- Exploratory data analysis steps
- Finding the correlations between variables
- Getting the trend of data
- Performing the visualization on data
- Looking at the quality of data
Simple methods to perform data understanding
Summary Statistics of Data

The best to understand data with the help of summary statistics that provides the mathematical values and statistical measures to represent data.
Some basic summary statistics which you can apply to data to measure the numerical and categorical values with mean, median, mode, range, and standard deviation, etc.
These statistical operations like mean and median are measured the location of specific values and mode value is used to show the most frequent occurrence of a number in your data set.
Similarly, other statistical methods like range and standard deviation are very significant to measures the spread or variance in your data.
Viewing these measures can give you a notion about the nature of data and it can tell you if there’s something wrong with your data.
This summary statistics techniques improve the examination process that helps to obtain something uncommon and suspicious in the data.
Exploratory data analysis

The EDA process helps to Perform the univariant, bivariant, and multivariant analysis on data to get each and every variable weightage and importance in data.
The univariant analysis uses to perform the statistical calculation and techniques on a single variable (column) to get the variability and usage in data.
After the univariate analysis, the next part of the analysis is bivariate analysis which uses get the similarity and relation between two variables in data.
At the last, you can perform the multivariant analysis on data to get exact judgment about variance in all variables and where you need to process the data.
Correlation in Data
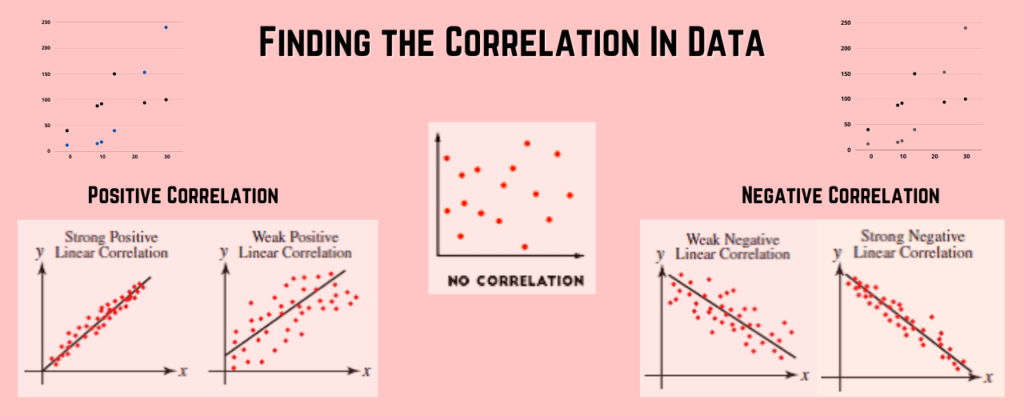
In the bivariant analysis, you can find the similarity and difference between two variables where correlation graphs or statistics can show the dependencies between two variables in the data.
The correlation analysis can estimate the negative or positive correlation between two variables in data to find the exact relationship between variables.
The correlation graph helps to get the variance and relationship between two variables in data which is a crucial part of data understanding.
Another way to get the similarity between variables using scatter plots that usually capture the correlation between two variables.
It shows variable dotes means the data points and spread of data either positive or negative direction to get the judgment of variables.
The trend in Data

The general trends in data mostly show you the pattern and sentiments of users and it is a simple graph of how the data is progressing over time.
The best example of trends in data is the share market data where different time windows like hourly, daily, monthly use to get the trend of any stock.
The line graph, Bar graph, helps to find the trend of data to understand the product sales and market movements
Visualization of the Data

Visualization techniques provide quick, effective, and very useful ways to look at data in the preliminary analysis.
Different types of graphs like histograms, bar charts, line charts display the distribution and trends of the data that can determine the skewness or unusual dispersion.
Scatter plots can show the correlation between two variables which accommodate to understand the difference and similarity in variables.
A heat map for an instance can quickly give you an idea of where the hot spots are available or you can get the more variability point in data.
Line graphs illustrate the values changes over time in data and the boxplots are crucial for showing data distribution.
There are various types of graphs and charts available that aid to visualize data those are very beneficial in understanding the data.
Finding the data quality Issues

Data quality issue is the very crucial factor that you really need to ensure while performing the data understanding and exploration task.
The issues like missing values in data, the number of outliers in data, replicated columns information, duplicates records, etc. need to identity.
Finding the data quality breaches and missing factors certainly expects more determination and accuracy while understanding the data.
Conclusion
In this article, you obtained that data understanding in data science is a fundamental process for correct analysis.
The data exploration needs to have a solid judgment of the investigation on data which leads to a more solid understanding of the complexity of the data.
Data understanding and exploring process normally guide you to get the key points of data that helps in the rest of the process of data analysis.

Meet our Analytics Team, a dynamic group dedicated to crafting valuable content in the realms of Data Science, analytics, and AI. Comprising skilled data scientists and analysts, this team is a blend of full-time professionals and part-time contributors. Together, they synergize their expertise to deliver insightful and relevant material, aiming to enhance your understanding of the ever-evolving fields of data and analytics. Join us on a journey of discovery as we delve into the world of data-driven insights with our diverse and talented Analytics Team.

